Quick Summary: I started using Telegraf to send data to InfluxDB so I could view it with Grafana. Here's how that has transformed the AstropotaPOD.
Introduction
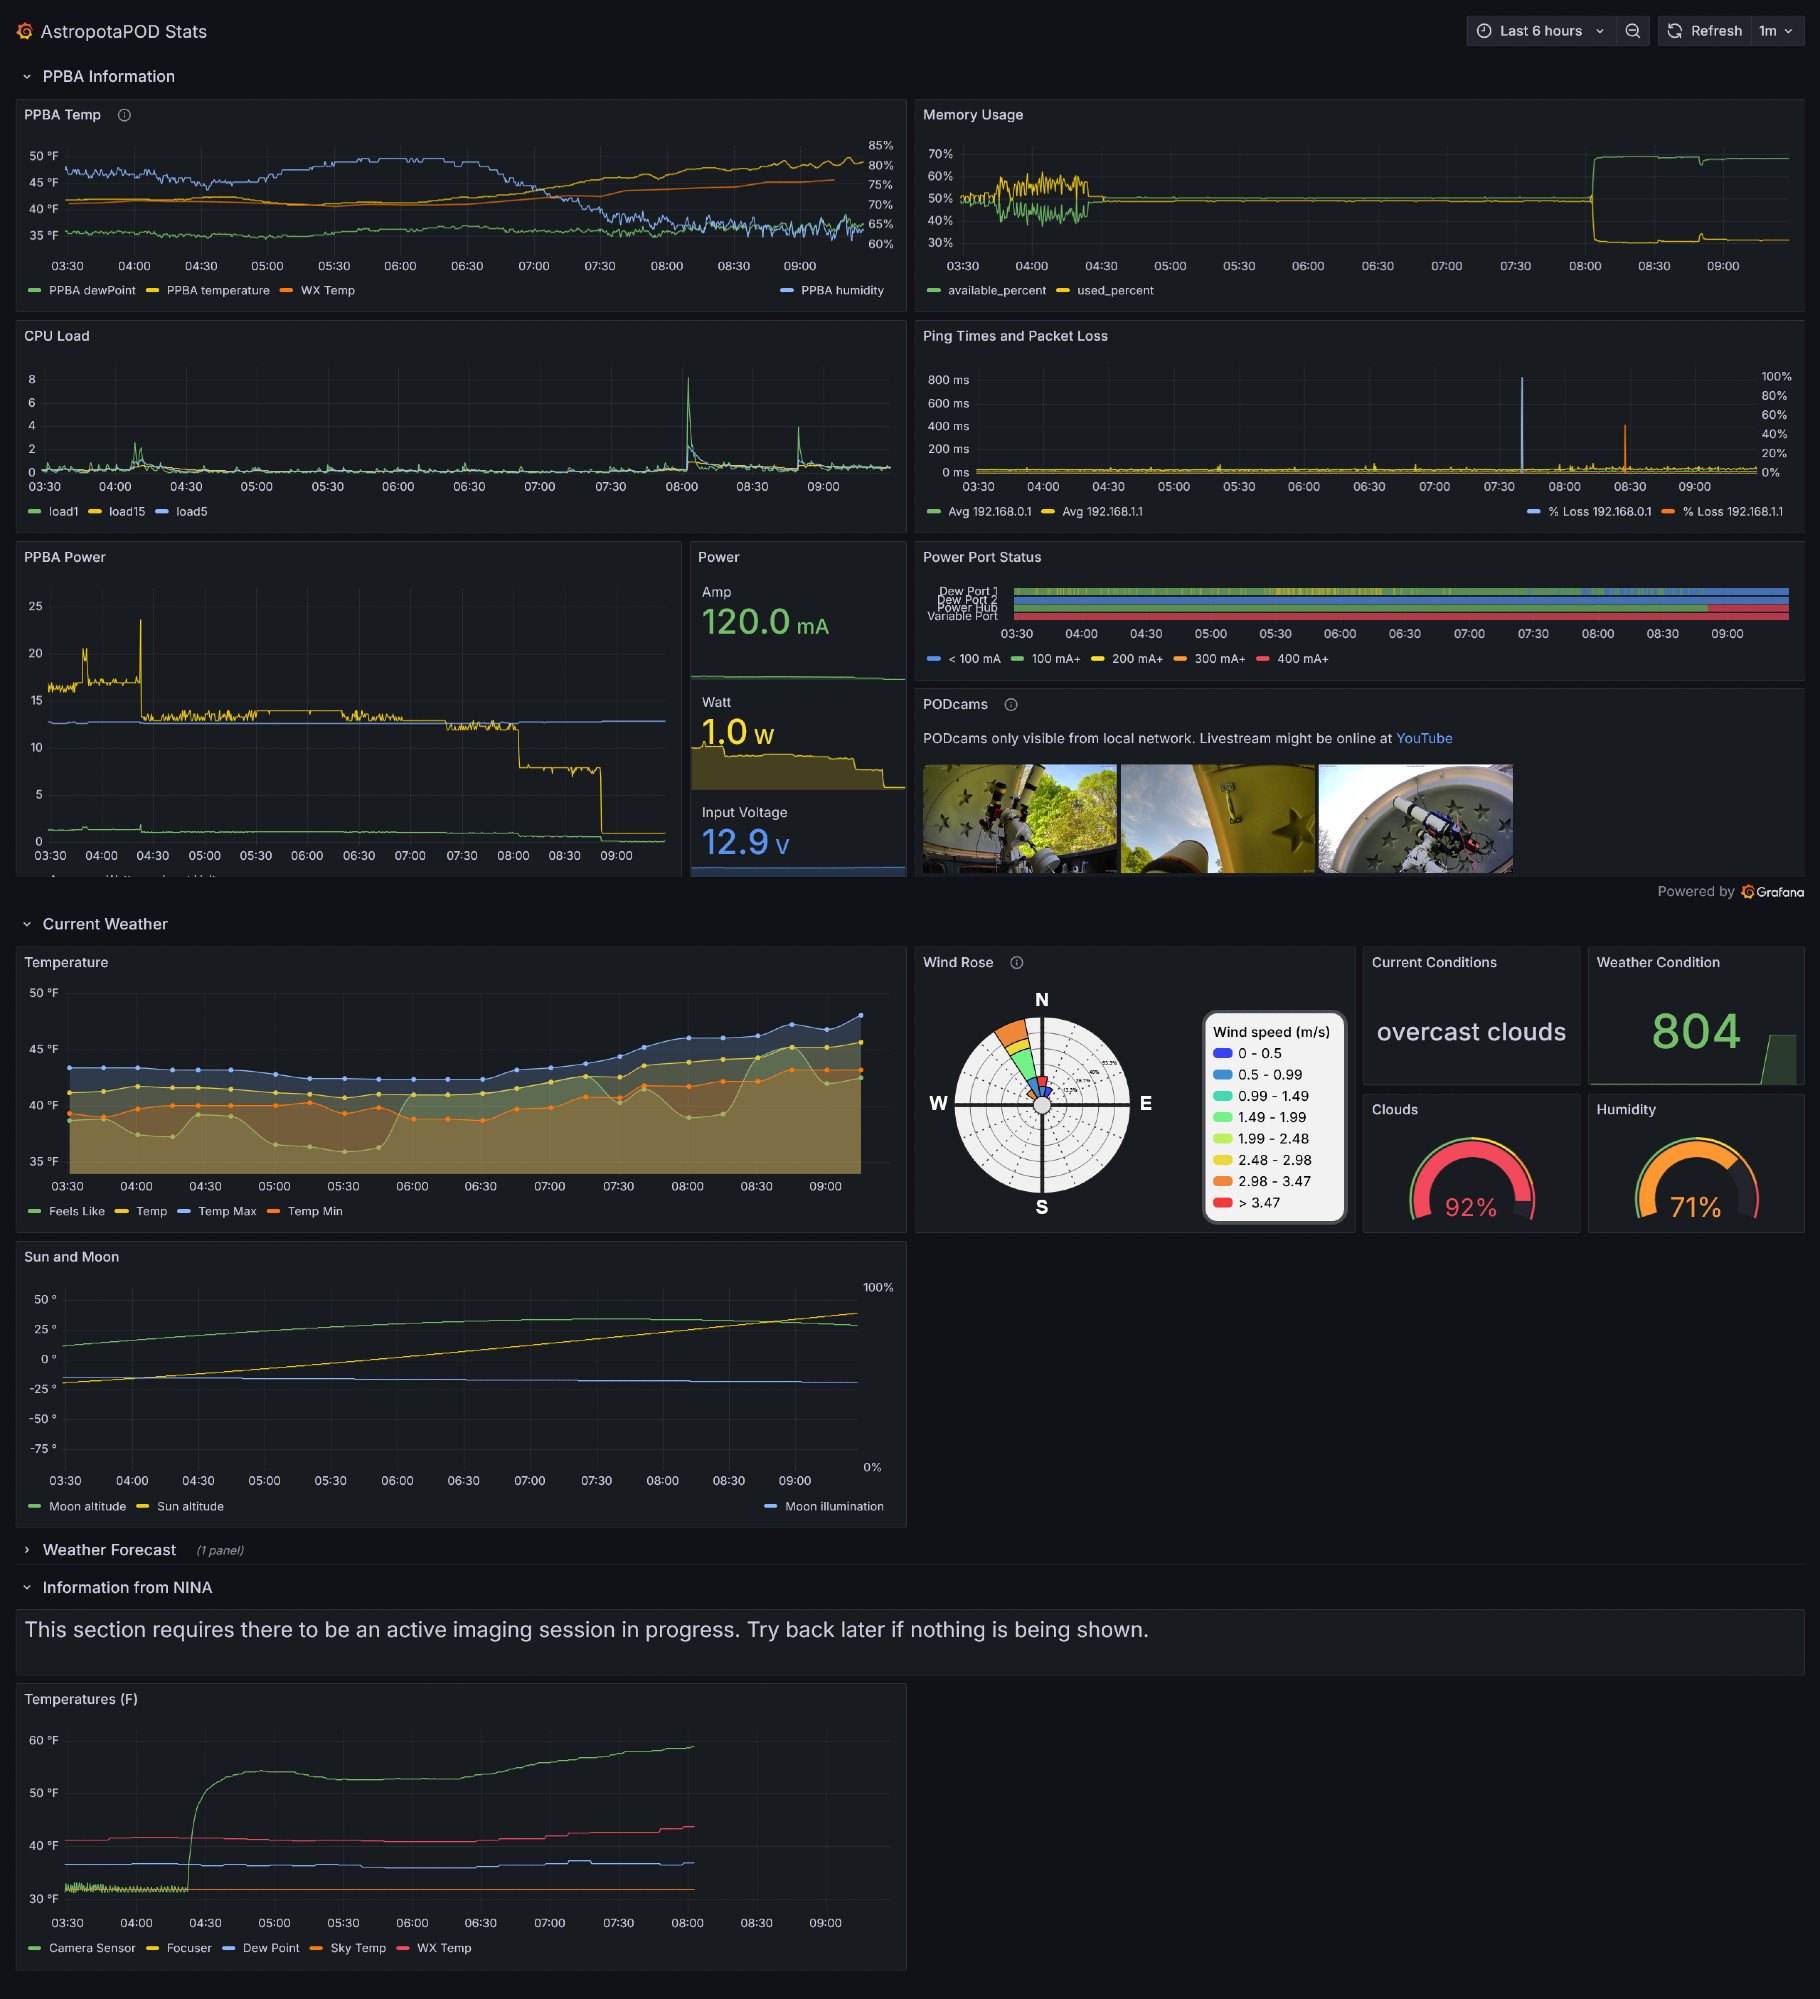 My AstropotaPOD houses my Time Machines and during the spring, summer, and fall, it has power 24x7. So I thought, why not gather data about what's happening with the equipment in the AstropotaPOD and put it on a display so I can see what's going on over time? Luckily, the Pocket Power Box Advance gives me most of the data I need, and the rest can come from Openweathermap and a built-in Grafana data source for Sun and Moon information. Let's take a closer look at what it's all about.
Telegraf and InfluxDB
Telgraf is an information gathering tool that predominately sends data to InfluxDB. InfluxDB is a form of database that captures and stores data over time. So simple examples would be temperature, power consumption, or the percentage of illumination of the Moon. Telegraf can gather information from many sources, but I chose three:
- Openweathermap, providing current weather via a call to telegraf every 15 minutes (also see the section on Grafana, below).
- System load, memory, and other stats from the Mele Quieter 4C astro computer running inside the AstrotaPOD.
- Using the Pegasus Astro Unity API to connect to the PPBA and gather information about power, temperature, and more.
The first set of data, above, is being gathered via a cron job running on the InfluxDB host itself, which is at my office. Luckily, I have resources there that I can use for this purpose, so if you want to run this yourself, your milage may vary. The other two sets of data are being gathered from the Mele mini-PC itself which means that if it restarts or is first turned on, I have to manually start Unity and then manually start the Telegraf connector program. At some point, I may automate those things. All of this information is sent to the InfluxDB instance running on that work server.
Grafana
Grafana is a graphing tool that integrates with many sources and provides for pretty pictures like what you see at the top of this article. I have it connected to three things:
- My InfluxDB server, where weather and PPBA information is stored.
- Another connection to Openweathermap, this time gathering forecast data for the next five days.
- The Sun and Moon plugin in Grafana that lists the Sun and Moon angle, illumination, rise, set, and other information.
Using all of this, I extract things like power usage, weather as seen by the Openweathermap service, temperatures inside the AstropotaPOD as seen by the Pocket Power Box, network connectivity, system resource usage, and more. Since the data is stored in InfluxDB and it is all time-series data, I can look at any period in the past or future. Obviously, the future is only useful for data that includes future dates, but that's what the weather forecast and Sun/Moon information is, so I can use this information to help plan imaging sesssion.
Why not gather data about what's happening with the equipment in the AstropotaPOD and put it on a display so I can see what's going on over time?
Cameras
I have Wyze Cam V3 and Wuuk PT cameras in the AstropotaPOD for security monitoring and livestreaming purposes. While they're not things that Grafana can pull from directly (nor do I think I would want to), I can have Grafana look at the snapshot images generated by those cameras every minute. Grafana only updates them every five minutes, but if you're on my local network, then you can literally see what's happening inside the AstropotaPOD as well. Clicking on an image in the Grafana display takes you to the live camera feed, and the whole thing integrates quite nicely to make it easy to monitor everything.
Final Thoughts
Not everyone has a permanent observatory. Not everyone who has a permanent observatory has permanent power. Many people run off of solar and batteries, or only provide power when they're using the observatory. But I figured, why not gather information and display it while I can, just to see what I can display? Lots of this information is available through Dale Ghent's fabulous InfluxDB Exporter plugin for NINA, and was in fact the inspiration for this project. But I wanted something that didn't require NINA to be running, and didn't connect via ASCOM, which doesn't play well with multiple connections. Plus the weather data can be collected externally so it can be gathered even when the AstropotaPOD is completely unpowered.
I'm quite pleased with the results and am considering having my company provide this as a service to others for a very small fee to cover the cost of the electricity for running the servers. We'll see how it goes!